9 Best Touchplan Alternatives for Construction Project Management in 2026
9 Best Outbuild Alternatives for Construction Project Management in 2026
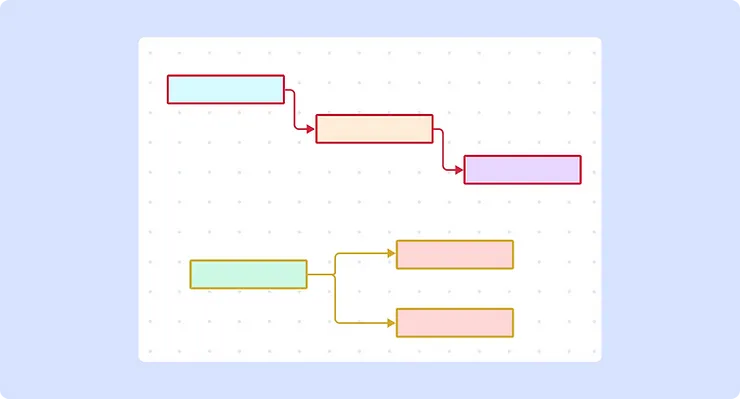
Critical Path Method (CPM) in Construction: A Full Guide
What's New in Planera: May 2026
The Best Procore Alternatives for Construction Scheduling
Moving From
Legacy Tools to Modern CPM, the Complete Guide for Modern Construction Teams
Elevating Construction Success: The Planera Support Advantage
The Shift from Oracle P6 to Planera: Why Leading Contractors are Choosing Collaborative Scheduling
Lookahead Scheduling in Construction: How to Plan Without Slowing the Job Down
New AI Agent Changes Construction Scheduling..Are Schedulers Now Redundant?
Construction Scheduling 101: Complete How-to Guide for Project Managers [2026]
What's New in Planera: April 2026
Planera Releases AI Schedule Assistant; DPR Rolls Out ConstructivIQ on 120+ Projects
Planera Launches Manny, Turning Construction Schedules Into Live Decision Engines
Scheduling Without a Data Date Is Not Just Bad Practice, It's a Liability
Best Microsoft Project Alternatives in 2026 (Top Tools Compared)
July Product Updates: Better bulk actions, Hide collaborator cursors & more
August Product Updates: Four new features + a speed boost you’ll love
September Product Updates: Smarter Permissions, Sharper Insights, Richer Context
October Product Updates: New sorting for P6 imports, flexible IMS, edit-in-Gantt, and more
November Product Updates: Clearer navigation, smarter safeguards, and smoother interactions
December Product Updates: update schedules with confidence, investigate issues faster, and avoid cleanup work
10 Best Primavera P6 Alternatives for The Construction Industry in 2026
The MS Project Retirement: Why Construction Leaders are Securing Their Future with Planera
February 2026 Product Marketing Update
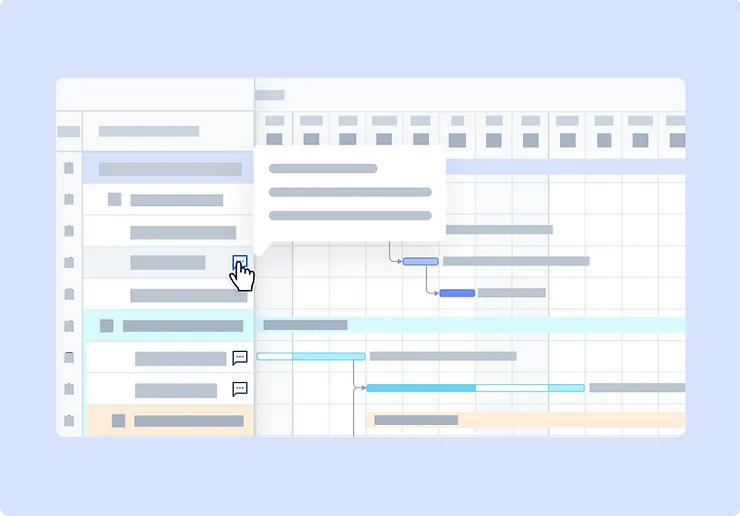
How to Read and Use a Gantt Chart for Construction Scheduling
Best Construction Workflow Management Software Picked for 2026
11 Best CPM Software of 2026 for Your Construction Project
Building Data Centers Faster and Smarter: Visual, Collaborative Scheduling Isn’t Just an Option—It’s a Business Mandate.
How Big-D Construction uses Planera to avoid ‘death by 1,000 paper cuts’
The Future of Construction Scheduling for GCs to Improve with AI using Planera
11 Best Construction Management Software Platforms to Compare in 2026
From Trailer to Tablet: Making Schedules Work Where the Work Happens
12 Digital Construction Tools Every Contractor Needs in 2026
50 Best Construction Scheduling Software Platforms in 2026
Change Leader: Why Infrastructure Projects Lose Margin Before They Break Ground
Planera Adds Industry Leaders Matt Burness and Mark Baracani to Strengthen Product and Construction Expertise
Planera Expands Data Centre Presence with New Funding
Planera Accelerates Data Center Expansion, Raises $8M in New Funding
Miles-McClellan Expands Scheduling with Planera for iPad
Planera September Update: Smarter Permissions, Sharper Insights, Richer Context
AMLI Residential Selects Planera to Transform Project Scheduling and Field Collaboration
The Future is Hybrid: Why Modern Construction Demands both CPM and Lean
The Evolution of Construction Scheduling in the Design-Build Era
Planera Featured on the Art of Construction Podcast
Report: Legacy Tools & Hiring Top Concerns Amid Construction Boom
Sticky Notes Don’t Scale: 5 Reasons to Choose Logic-Driven Scheduling
Drill Tech Selects Planera for Schedule-Critical Tunnel Projects
Scheduling That Keeps Up with Data Center Demands
Bridging the Skills Gap: PlaneraEDU Prepares Digital Jobsite Pros
Watch the Webinar! Planera Field Schedules Linked to Master Plan
Planera Wins 2025 Gold Globee® Award for Disruptors
Planera Launches Collaborative Field Scheduling for Teams
Planera CEO Nitin Bandhari Featured on ENR's Critical Path Podcast
Nitin Bhandari Wins Best Innovative Entrepreneur Award
Not a ‘Shiny Toy’: Contractor Overhauls Scheduling Without Hype
Planera Featured on Construction Conversations Podcast
How Planera Improves Construction Planning with Visual Workflows
Zachry Construction Uses Planera to Optimize Resource Scheduling
Planera Launches Visual, Collaborative Field Scheduling on iPad
Planera Featured on Category Visionaries Podcast
Now Live: Planera on iPad
Planera Featured on AEC Trailblazers: The Founders Files Podcast
Full-Stack Scheduling: Transforming Specialty Contracting Projects
Feature Updates: Variance insights, linked schedules, and more!
Monthly Feature Highlights: More Control for Better Collaboration
Planera and Big-D Construction Partner to Drive Scheduling Innovation
Construction Magazine Feature: Democratizing Scheduling
Take Control: New Features for Secure Collaborative Scheduling
Silo Busting: Why Collaboration is Critical to Construction Success
Planera CEO Featured on The Digital Executive Podcast
Visual Scheduling Tech Boosts Construction Productivity in 2025
January Monthly Feature Highlights
Planera Offers Free Scheduling Software to U.S. Universities
Planera Wins Great Graphics Contest at CPM Conference
Planera Surpasses 25 Million Days of Schedule Managed
Product Updates: Planned % Complete, Variance Codes & More
Product Updates: Trace Path, ALAP Constraint & Sorting Options
Planera Achieves SOC 2 Type 2 Compliance
Beyond Deadlines Podcast with Nitin Bhandari
Hugh Seaton Hosts Nitin Bhandari On His Constructed Futures Podcast
Planera raises $13.5M to help solve the gnarly problem of scheduling for construction contractors
5 Contech Firms Raise Over $126M
Sept '24 Updates: Float Path, Table/Gantt Commenting, S Curve
CSU East Bay Finds Visual Scheduling Superior to Tabular Tools
2024 Construction Planning Trends to Watch
Save Filters to Use Later
Multiple Project Versions to Eliminate Clutter and Mistakes
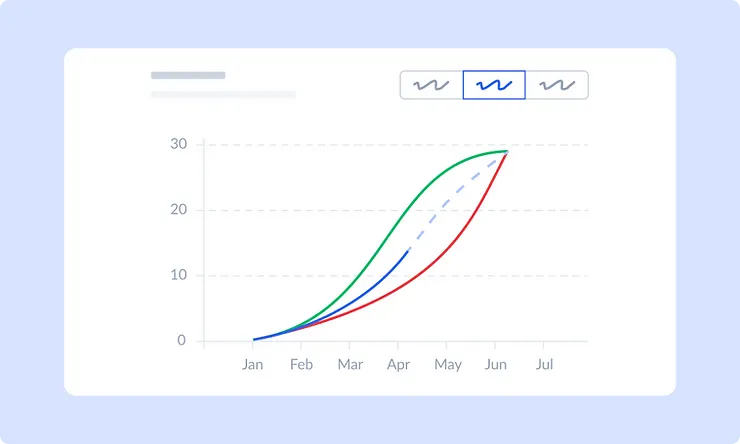
Master Risk with Monte Carlo Simulations
Turbocharge Scheduling: DCMA 14 Integrated with CPM Scheduling
Scotland Foss Joins Planera as Company’s First Head of Sales
Planera + Autodesk Cloud: Streamlined Scheduling & Planning
Slice of Construction Podcast: Scheduling with Nitin Bhandari
Planera Secures $13.5M to Disrupt Scheduling & Planning Market
New Features: More Colors, Insert/Dissolve and More
Planera Raises $5.4M to Transform Construction Project Planning
Planera Raises $13.5M to Solve Construction Scheduling Challenges